Why do we care?
Economic well-being is one of the three axes of sustainability and an important part of our quality of life. Disposable income is a measure of economic well being, showing how much we can spend on our homes, our food, our children’s educations, or services that allow us to spend time enjoying ourselves rather than working. While some of our consumption choices can work against sustainability by harming the environment, having the option to make choices is clearly a good thing.
How are we doing?
Disposable income per capita measures the average amount of income available per household after taxes. As Figure 1.1 shows, it has risen steadily in New Jersey for half a century. As the figure also shows, New Jersey’s per capita disposable income has consistently been higher than that of the nation as a whole, suggesting that we are among the best off citizens of the country economically.
What is behind these figures?
The gap between the richest and poorest is an important issue in considering income in a sustainability context. One measure of income inequality is the Gini coefficient, which ranges from 0 in a society where all incomes are identical to 1 in a society where one person earns all of the income. Figure 1.2 provides Gini coefficients for the US and New Jersey from 1969 to 1999. They show a steady widening of the income gap both in the US as a whole and in New Jersey. They also show that New Jersey was considerably more equitable than the country as a whole forty years ago, but the state has become somewhat less equitable.
What else would we like to know?
To assess the sustainability of our income growth, it would be helpful to link income trends with changing consumption patterns, so we could assess the impact of our expenditures. It would also be useful to compare our high incomes with the cost of living in New Jersey, to assess whether in fact we are as well off as we seem to be based on income alone.
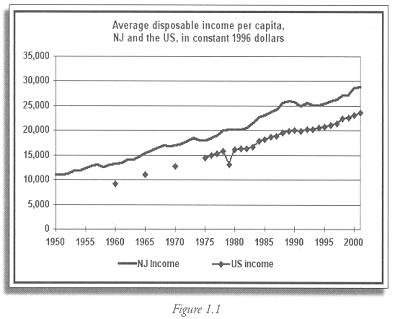
Figure 1.1 Bureau of Economic Analysis Regional Account Data, Annual State Personal Income. Constant dollars are adjusted for inflation and indexed here to make all years comparable to 1996. Available at: http://www.bea.gov/bea/regional/spi
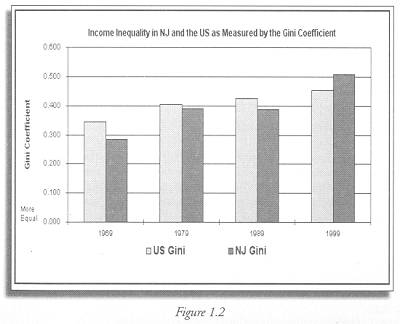
Figure 1.2 Gini coefficients for the US and NJ calculated based on Census data on households by income class. Data for 1989 and 1999 are available in the in the Census Summary File 3 (SF3), available on the web by selecting the appropriate year and file in the “All data sets” page of the American Factfinder, on the US Census website,http://www.census.gov. Data for earlier years are in the 1970 and 1980 Censuses of Population, Volume 1 Characteristics of the Population, volumes for the US and New Jersey.
Indicator Target:
Targets with which to assess state progress have not yet been established for this indicator.