Why do we care?
The unemployment rate measures the number of people actively looking for jobs as a share of those considered to be in the labor market. Unemployment affects individual well-being, and the rate of unemployment tells us about the health of the state’s economy. High unemployment means financial hardship for individuals and families. They, in turn, are less able to buy goods and services, which detracts from the strength of the economy. Communities with high unemployment often suffer from increased rates of crime, domestic violence, and substance abuse. Moreover, communities with high unemployment will collect less tax revenue, hampering the government’s ability to allocate resources to solving these social problems. Regional and ethnic disparities in unemployment rates in New Jersey may also divide us as a society, exacerbating inequity and social tension.
How are we doing?
As Figure 2.1 shows, New Jersey’s unemployment rate has fluctuated widely over the past decades. Over the past decade, the state’s unemployment rate has tracked fairly closely with the country as a whole, although we were slightly higher than the rest of the country prior to the 2001 low point and slightly below it since then. Only occasionally has New Jersey unemployment dipped below the 5% level historically considered to indicate full employment.(1) The key question right now, of course, is the impact of the recent recession, the September 11 attacks, and whether the current recovery will have a positive impact on employment. The annual data in Figure 2.1 show that unemployment rose sharply since 2000. Monthly data for January to August 2004, ranged from a high of 5.7% in March to a low of 5.4% in August, with an average of 5.6%, so we seem to be making some progress this year.(2) The 5.8% unemployment rate at the end of 2002 means that just over four million people were working in the state out of a total population of about 8.4 million.(3)
What is behind these figures?
Data on employment by sector complement the unemployment rate by shedding light on the structure of our economy. Figure 2.2 shows that New Jersey is increasingly a service-based state, which is consistent with the growth of hightech industry. Between 1991 and 2001 the service sector grew steadily. Wholesale and retail trade grew except for the last year of the time series, when it held constant. Manufacturing, on the other hand, has declined in absolute terms and, of course, as a share of employment.
What else would we like to know?
The unemployment rate does not tell us about underemployment, which exists when people are in very low-productivity positions or below their skill level. It also does not account for those who have given up on finding a job and dropped out of the labor market, nor does it include those who choose not to hold paid employment for family or other personal reasons. Information about these questions would provide a clearer understanding of employment in the state.
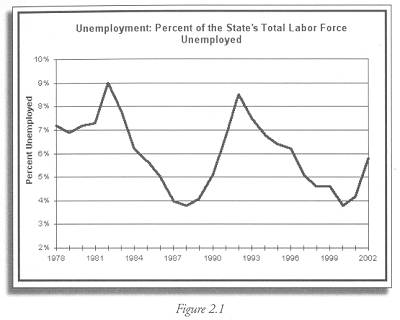
Figure 2.1 NJ Office of Labor Planning & Analysis, Labor Market Information, Unemployment and Labor Force Estimates, Historical Data. Available at: http://www.state.nj.us/labor/lra/
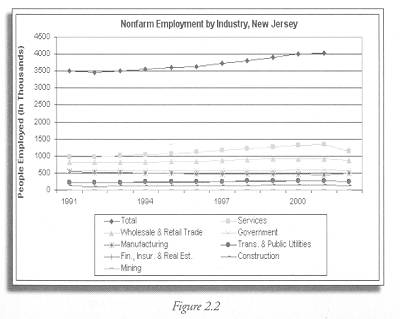
Figure 2.2 Current Employment Statistics Survey, http://www.bls.gov/ro3/fax_9582.pdf
Indicator Target:
Targets with which to assess state progress have not yet been established for this indicator.
———-
(1) Like any other market, the labor market is composed of buyers (employers) and sellers (jobseekers). For the well-being of the economy as a whole, both must be able to find what they need in the market. Although it may seem counterintuitive, it is desirable to always have some people looking for work; otherwise businesses would not be able to find employees when they wish to expand, and economic change or growth would not be possible. While there is controversy over this definition, economists have historically considered 95% employment to be the maximum the economy can sustain, or “full employment.”
(2) Bureau of Labor Statistics, http://data.bls.gov/servlet/SurveyOutputServlet?series_id= LASST34000004&data_tool=”EaG” As of September 2004, when this report went to press, data were available through August 2004.
(3) http://www.wnjpin.net/ OneStopCareerCenter/LaborMarketInformation/lmi16/release1.htm#press