Why do we care?
Productivity measures the value of output relative to the resources used to produce it. It is closely related to well-being. The more productive we are, the more efficiently we are using our resources, because we can generate more output from the same quantity of input. For employees, this can mean higher incomes and higher living standards. For business, it can mean more output with the same inputs, and therefore more profit or more resources to reinvest in growth and the ability to remain competitive in national or global markets.
How are we doing?
As Figure 3.1 shows, labor productivity in New Jersey increased during most of the last fifteen years, from $52,100 in 1986 to $69,800 in 2001. In 2001, it dropped slightly to $69,600. This drop is likely to be a result of the current recession, which began with a drop in GSP not immediately matched by drops in employment. Since 1986 New Jersey productivity has been below US productivity, but it almost caught up by 2001. It has also been less volatile than the US figures.
What is behind these figures?
Labor productivity is calculated as Gross State Product (GSP) per full-timeequivalent worker in the state’s economy. If GSP grows faster than employment, labor productivity will increase. This can reflect several possible changes in the economy. Workers might be better educated or managed, so each person produces more. Employers might be pushing them to work harder and produce more, as often happens at the end of a recession when demand grows but employers are reluctant to hire additional workers. It could reflect introduction of more efficient production technology.
If employment decreases, the impact on GSP, and therefore on employment, will depend on which workers become unemployed. If the least productive ones are laid off, productivity will rise, whereas if highly-skilled people lose their jobs productivity is likely to drop. Job losses due to increased productivity are understood in two quite different ways; for the unemployed, they are a serious problem, while from a growth perspective they can be understood as freeing up labor for new enterprises.
The relationship between sustainability and changes in labor productivity depends on what caused the change. If labor becomes more productive with no increases in other inputs – say because workers are more motivated – then we are more sustainable because we are using resources more efficiently. Increases in labor productivity due to more consumption of other inputs, wasted natural resources, or more pollution, are not sustainable.
What else would we like to know?
To understand the links between productivity and sustainability, it would be good to know what drives productivity growth. This would require both a sectoral breakdown of the productivity measures, and data about use of other inputs into production in each sector. This would show us both where the change has actually occurred and what might be causing it. It would also be good to know who benefits from increased productivity; is the surplus used to pay higher wages, to invest in expanding the business, or to increase profits?
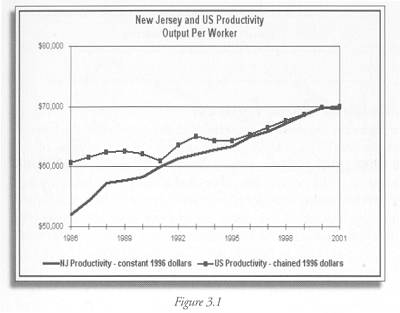
Figure 3.1 Productivity figures calculated from output and employment figures. New Jersey GSP data are from the U.S. Department of Commerce, Bureau of Economic Analysis, Regional Accounts Data, http://www.bea.gov/bea/regional/gsp. NJ employment data are also from BEA, through http://www.bea.gov/bea/regional/reis/default.cfm. US GDP data are from the BEA at http://www.bea.gov/bea/dn/gdplev.xls. US employment data are from the US Department of Labor at http://data.bls.gov/servlet/SurveyOutputServlet.
Constant dollars are adjusted for inflation and indexed here to make all years comparable to 1996. Chained dollars likewise adjust for both inflation and changes in sectoral composition.
Indicator Target:
Targets with which to assess state progress have not yet been established for this indicator.