Why do we care?
Interaction between students and teachers is one of the most important elements of the educational process. When students and teachers can communicate easily, the students are likely to be more engaged in what they are learning, and teachers will be better able to identify problems and encourage progress.
The student-teacher ratio is used to assess the potential for such interaction. It does not directly measure class size, as it is calculated based on the total number of full-time equivalent teachers, including those who teach special classes such as music or gym, and those who teach in much smaller special education classes. Nevertheless, this ratio is a reasonable proxy for average class size and student-teacher interaction.
How are we doing?
As Figure 14.1 shows, the student-to-teacher ratio for New Jersey public schools rose in the early 1990s and then dropped from a high of 14.2 in 1996 to 13.1 in 2001. In comparison, the ratio for the nation as a whole was 15.9 students per teacher in 2001, down from 17.3 in 1991, so New Jersey is doing well by national standards.
What is behind these figures?
From a policy perspective, it is important to know whether the ratio dropped because the number of teachers rose or the number of students declined. In fact, both figures rose over the past ten years, but the number of teachers rose faster than the number of students. In New Jersey, the student population grew by 20.2 percent between 1991 and 2001, while the number of teachers grew by 24.8 percent.(1)
Since 1999, this pattern has been strengthened by a Federal initiative to reduce class size in the public schools, enacted under Title VI of the Elementary and Secondary Education Act.(2) This program provided funds to the states to enable local school jurisdictions to hire additional teachers, with the goal of reducing class sizes in the early elementary school grades to no more than 18. The program also places a strong emphasis on teacher training, since teachers moved from large to smaller classes may be able to apply new teaching techniques. In fiscal year 2001, the funding for this initiative was $1,623 million, of which New Jersey received $37 million or 2.28%.(3) This program has since been subsumed within the No Child Left Behind Act of 2001.
What else would we like to know?
These figures give us averages for the state as a whole, but do not show us the variation among schools or towns. It would be useful to see how studentteacher ratios vary across jurisdictions, and to link that to income, racial composition, and school performance, to understand better how we can improve education in the state.
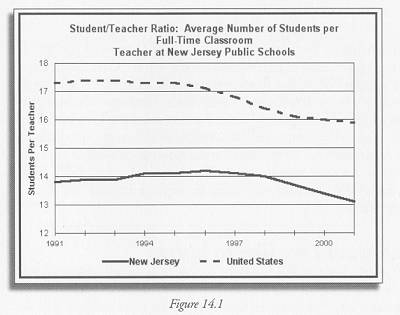
Figure 14.1 New Jersey data from NJ Department of Education – New Jersey Education Statistics – Vital Education Statistics, http://www.state.nj.us/njded/data/vitaled/0102/vitaled0102-s5.pdf US data from US Department of Education, National Center for Education Statistics, http://nces.ed.gov//programs/coe/2001/section4/indicator38.asp
Indicator Target:
Targets with which to assess state progress have not yet been established for this indicator.
———-
(1) Tabs, E.D. 2002. Public School Student, Staff, and Graduate Counts by State: School Year 2000 – 01, NCES 2002-348. National Center for Education Statistics. U.S. Department of Education. http://nces.ed.gov/pubs2002/2002348.pdf Table 10, Public School Membership and Total Teachers, by State.
(2) Class Size Reduction Program Guidance http://www.ed.gov/offices/OESE/ClassSize/guidance.html
(3) Class Size Reduction Final FY 2001 Allocations http://www.ed.gov/offices/OESE/ClassSize/CSAllocation/cs-usa.html