Why do we care?
Performance on standardized tests provides some understanding of how many students are acquiring basic skills in reading, mathematics, and writing. This indicator matters both because it gives us some understanding of whether our students are being educated, and because it tells us whether our schools are performing well enough to meet our needs.ratio is a reasonable proxy for average class size and student-teacher interaction.
How are we doing?
Figure 15.1 shows the percent of students in the regular curriculum (excluding those in special education or with limited English proficiency) who passed each section of the 11th grade High School Proficiency Test (HSPT) between 1993 and 2000. While there has been some fluctuation, the rates have not changed significantly over that period. There is a large gap among races in performance on these tests; as Figure 15.2 shows, white students do much better than blacks or Hispanics on average.
What is behind these figures?
Tracking performance on standardized tests in New Jersey is difficult, because over the past twenty years no one test has been given consistently to public school students. The HSPT, on which this indicator is based, has sections on reading, mathematics, and writing, and students must pass all three to receive a high school diploma. If they fail a section, they may receive additional instruction and take that portion of the test over.
In 2001, the High School Proficiency Assessment (HSPA) replaced the HSPT. It is designed to assess mastery of the material included in the Core Curriculum Content Standards and Workplace Readiness Standards. The HSPA consists of two sections – language arts literacy and mathematics – and students must pass both to receive a high school diploma. Once the new standards have been fully implemented, they will permit reliable comparisons across jurisdictions. However, the results may not be consistent with historical data, since both the curriculum and the tests will have changed. The first data for the HSPA, from March 2002, show 90% of students proficient in language arts and 76.8% proficient in mathematics.(1)
What else would we like to know?
What we really care about in this indicator is how well we are educating our students – both to assess what they are learning and to assess how effective our educational systems are. Standardized tests may be the most efficient way we have developed to track performance on a large scale, but it is well understood that they lead to teaching to the test, and that some students perform much better in an educational setting that is not organized around standardized testing.
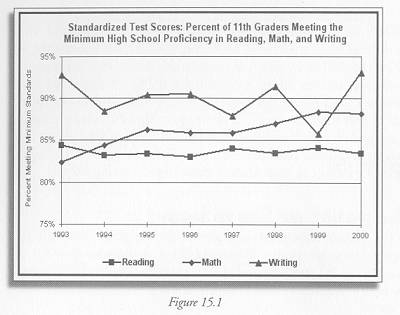
Figure 15.1 Summary data through 1999 are available from the New Jersey Department of Education – New Jersey Education Statistics – New Jersey Statement Assessment Reportshttp://www.state.nj.us/njded/schools/achievement/index.html. Summary data for the 2000 HSPT are not available on the web. They are produced by the Office of Evaluation and Assessment and may be requested through the NJDED Public Information Office. Detailed 2000 HSPT results by school are available on the web.
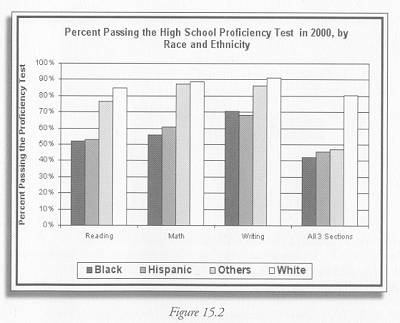
Figure 15.2 New Jersey Department of Education, New Jersey Education Statistics, January 2002 New Jersey Statement Assessment Reports, Table entitled “Detailed charts on the statewide assessment data by race/ethnicity, gender and socioeconomic factors”, data on 11th grade testing in:http://www.state.nj.us/njded/schools/achievement/2002/detail.pdf
Indicator Target:
Targets with which to assess state progress have not yet been established for this indicator.
———-
(1) Data for the High School Proficiency Assessment are available on the NJ Department of Education website at http://www.state.nj.us/njded/schools/achievement/2003/hspa_state.htm