Why do we care?
Energy efficiency measures the output of our economy relative to the amount of energy we use. It is closely linked to sustainability in several ways. Energy is a major input into productive activity such as manufacturing, transportation, agriculture, and electricity generation, as well as into consumption in our homes and cars. The more efficient we are – i.e. the less energy intensive our economy – the less we spend on energy; so greater energy efficiency is clearly desirable.
Energy makes our lives easier, but its creation and use often hurt the environment. Combustion of oil, gas, and coal generates air pollution and greenhouse gas emissions; nuclear power poses risks associated with waste disposal, accidents, and terrorism; waterpower alters the natural flow of rivers; wind turbines consume land, affect views, and may pose a risk to migratory birds. The extraction of coal, oil, and other fossil fuels directly hurts the environment, requiring additional costs for environmental protection. Clearly the less energy we use, the lower the environmental costs that we face.
Our energy sources themselves put us at risk. Fossil fuels are fixed in supply; while there is debate about whether we are actually in danger of running out, greater energy efficiency will put off this concern. Moreover, we rely heavily on imported oil, putting our economy and our country in a vulnerable position. Understanding our energy use and its sources will help us manage our dependence on other countries.
How are we doing?
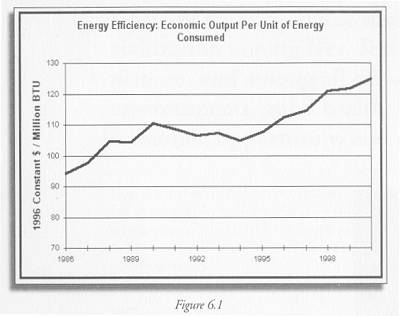
As Figure 6.1 shows, New Jersey’s energy efficiency has improved over the past fifteen years. Our Gross State Product has grown much faster than our energy use, so our energy efficiency has risen. This is good news, since it means that we are receiving the benefits that come from economic activity, while reducing the societal and environmental harm that can be associated with energy use. However, many people feel that we should be doing much better than we are.
What is behind these figures?
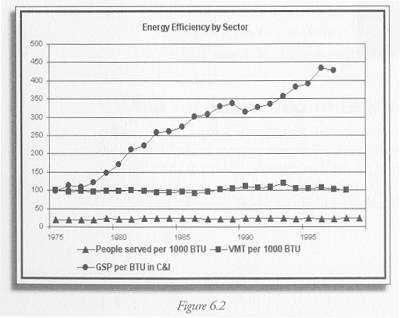
We can understand this trend better if we disaggregate the data to see where the improvements have actually occurred. Figure 6.2 presents data on energy use in three major areas: residences, transportation, and commercial and industrial activities. The bottom line shows the number of people served per thousand BTUs of residential consumption, which has stayed virtually constant from 1975 to 1999. The middle line shows vehicle miles traveled (VMT) per unit of energy. This increased slightly between the mid 1980s and the peak of 119 in 1993, and has declined sharply since then. This may be due to the recent trend towards sport utility vehicles and other large cars, which certainly will not help us to achieve such efficiencies in the future. The top line shows Gross State Product divided by energy use in commercial and industrial activities, a very broad category that includes manufacturing, stores, offices, schools, hospitals, government agencies, and so on. The dramatic increase in energy efficiency may reflect shifts in the state economy from manufacturing to service activities. To the extent that this is the case, we may simply be exporting our energy use to other states or countries, rather than actually decreasing our consumption.

Figure 6.1 Data provided by Michael Aucott, NJ Department of Environmental Protection, based on U.S. Energy Information Agency data.
Constant dollars are adjusted for inflation. BTUs are British Thermal Units.

Figure 6.2 U.S. Energy Information Agency, Individual State Data, New Jersey http://www.eia.doe.gov/emeu/states/_states.html – to search for data by state. http://www.eia.doe.gov/emeu/states/sep_use/total/use_tot_nj.html – to find these data. Table 7, Energy Consumption Estimates by Source, Selected Years, 1960-2000, New Jersey
BTUs are British Thermal Units
VMT is Vehicle Miles Traveled
$GSP is Gross State Product
C & I is Commercial and Industrial energy use.
Indicator Target:
Targets with which to assess state progress have not yet been established for this indicator.
