Why do we care?
High school graduation is an essential first step to having a life of choice and economic opportunity. With recent advancements in technology, demands for highly skilled, trained and educated employees have steadily increased. As a result of these changes, a high school education is a minimum in the labor market, and is a requirement for accessing various forms of higher education and training. In a sustainable society, everyone has as much opportunity as is possible for them, so high school graduation rates are a useful measure of what will be available to our young people later in life.
How are we doing?
Graduation rates are calculated by comparing the number of students in the graduating class with the number of entering ninth graders four years earlier. They have fluctuated considerably over the past fifteen years, from below 80% to almost 90%. In contrast, the national average in 2000 was only 69%, so New Jersey’s performance is comparatively good even at its worst.(1)
What is behind these figures?
The causes of these fluctuations are not clear. Conventional wisdom holds that when the economy is strong and jobs are plentiful, graduation rates decrease, while in a tough economy they rise, as students do not have lucrative alternatives to staying in school. Our data only partially fit this pattern, though if it does hold then we should expect to see further increases in graduation rates when more data become available in the next few years.
Figure 13.2 compares the racial composition of the 2000 graduating class with the composition of the population aged 15-19. These data are not entirely precise, because the racial categories in the census population data are different from those in the education data; thus this figure covers 99.8% of high school graduates but only 97.5% of the population. The information it shows is nevertheless interesting. Hispanics are graduating from high school at less than the rate we would expect based on their representation in the population; they account for 11% of the graduating class but 17.3% of the high-school age population, or about 63% of the rate we would expect. Blacks are graduating at about 90% of the expected rate. Whites and Asians, on the other hand, are graduating at higher than the expected rate, at 116% and 117%, respectively.
What else would we like to know?
Additional information about the considerable fluctuations in graduation rates over time would be valuable for understanding how to improve high school education.
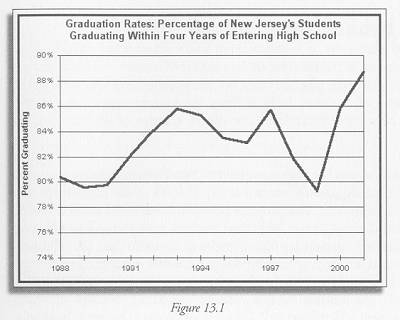
Figure 13.1 New Jersey Department of Education, Vital Education Statistics, Section IV High School Graduate Information. http://www.state.nj.us/njded/data/vitaledtoc.htm.
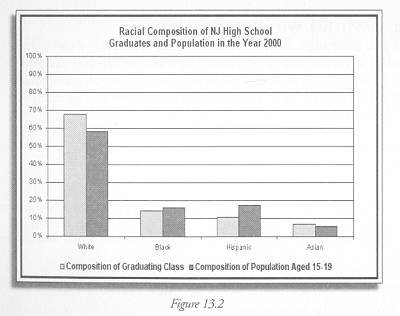
Figure 13.2 Graduation rate data from New Jersey Department of Education, New Jersey Vital Education Statistics – 1999-2000, Table 20. http://www.state.nj.us/njded/data/vitaled/9900/vitaled9900-s4.pdf
Population data are from the 2000 Census, Summary File 2 (SF 2) 100-Percent Data, Quick Tables, Table QT-P1, Age Groups and Sex: 2000. They can be accessed through the “detailed data” links at http://factfinder.census.gov.
Indicator Target:
Targets with which to assess state progress have not yet been established for this indicator.
———-
(1) Jay P. Greene and Marcus Winter, November 2002. “Public School Graduation Rates in the United States” Published by the Center for Civic Innovations at the Manhattan Institute for Policy Research. http://www.manhattan-institute.org/html/cr_31_table_2.htm