Why do we care?
This indicator measures undergraduate enrollment in New Jersey’s colleges and universities as a share of state population. It can be important to sustainability for several reasons. If our higher education systems are strong, we will have a large pool of educated labor in the state, making it easy for dynamic industries such as high technology and pharmaceuticals to locate and expand here. A strong educational system will also offer enough educational opportunity to keep our students in the state, so they can choose to stay in the region where they grew up, rather than having to go elsewhere to be educated and pursue their dreams. There are differences of opinion, however, as to whether the share of enrollment in in-state schools actually measures access, or is simply a reflection of student choice.
How are we doing?
As Figure 16.1 shows, enrollment per capita has risen since 1965, but has remained relatively stable since 1975. The fluctuations since 1975 reflect change in the economy as a whole. When the economy is doing poorly and unemployment is high, more students enroll in college, whereas when the economy is strong, some students choose jobs over school. A comparison with Indicator 2 on unemployment shows that the fluctuations are exactly the same in those two graphs. The most recent employment downturn occurred in 1998, and students have come back to higher education since then.
What is behind these figures?
Data on the number of New Jersey students going to college out of state, and the number of out-of-state students studying in New Jersey, show that the state is a net exporter of students. About 29 percent of the state’s high school graduates go to college out of state, while just under 92 percent of students at New Jersey institutions came from within the state. Not surprisingly, 98 percent of community college students are in-state, while 76% of students at private colleges are in-state. Interestingly, only 31.5 percent of students at religious institutions are in-state, suggesting that New Jersey is a major supplier of religious higher education to the region.(1)
Figure 16.2 shows the racial breakdown of enrollment at NJ colleges and universities. The share of white students in New Jersey colleges and universities, at 65.8% in 1994 and 59.1% in 1999, is considerably lower than their share among high school graduates, which is estimated at 85%.(2) Although we lack full information to know for sure, this may suggest that white students are more likely to go out of state than minorities. It also suggests that the in-state schools are targeting a population that may not have the resources to leave home for college. Without additional data, however, and an explanation of the large “other” category, we cannot be sure whether these hypotheses are correct.
What else would we like to know?
Our data are not detailed enough to really answer the questions we are asking about our higher education system. We would like to know who goes out of state, and who comes in, and why they make these choices, to really assess whether New Jersey high school students have access to the higher education options they want.
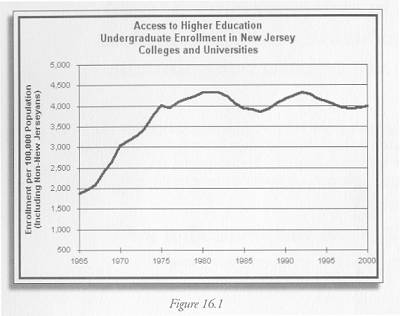
Figure 16.1 New Jersey Commission on Higher Education – The Sixth Annual Systemwide Accountability Report, Table 6, page 18, “Total Headcount Enrollment”http://www.state.nj.us/highereducation/ar06.pdf or http://www.state.nj.us/highereducation/reports.htm
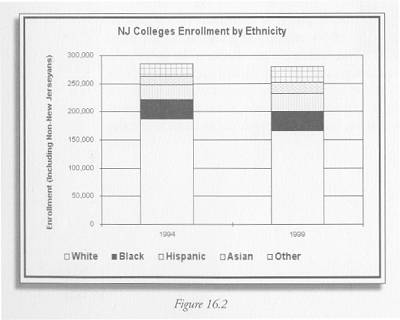
Figure 16.2 New Jersey Commission on Higher Education, “Status of Minorities in New Jersey Higher Education October 2000” http://www.state.nj.us/highereducation/minoritytat.htm
Indicator Target:
Targets with which to assess state progress have not yet been established for this indicator.
———-
(1) New Jersey Commission on Higher Education – The Sixth Annual Systemwide Accountability Report, Table 8, “Undergraduate Headcount Enrollment, by State Residence and Institutional Type.” http://www.state.nj.us/highereducation/ar06.pdf or http://www.state.nj.us/highereducation/reports.htm
(2) Jay Green, April 2002, “High School Graduation Rates in the United States – Revised” Prepared by the Manhattan Institute for Policy Research, for the Black Alliance for Educational Options. http://www.manhattan-institute.org/cr_baeo.pdf Table 1