Why do we care?
We want to live in an equitable society, where people are paid based on their work, not their gender, race, or ethnicity. People who suffer from discrimination based on traits that have nothing to do with their skills are less likely to feel ownership of their society, less likely to work to make it a better place. A society in which everyone feels like a welcome and equal participant, on the other hand, will be more sustainable, and better able to grow, evolve, and adapt to change.
How are we doing?
We still have considerable pay discrepancies across gender, racial and ethnic lines. This indicator compares the hourly wages of women and men and of whites, blacks, and Hispanics. As Figures 7.1 and 7.2 show, men earn more than women, and whites earn more than blacks or Hispanics. While all incomes rose over the past decade, women’s position relative to men worsened and then returned to its original level. The positions of blacks and Hispanics have worsened substantially relative to whites over the same period. New Jersey is becoming less rather than more equitable, as measured by paychecks.
What is behind these figures?
Interpreting these inequities is difficult. While discrimination may explain them, historically, women and minorities have had less education than white men. Whatever the explanation, these data show significant inequities in our society.
We can learn a bit more from the data themselves. Table 7.1 compares the wages in each group to average wages, showing the inequity in the wage distribution. If all groups were paid at the same rate, the wages of each group would be 100% of the average wage. A lower percent means that a group is paid less than average, while a higher percent means they receive more. The trend in the share earned by each group shows whether wage rates are becoming more or less equitable.
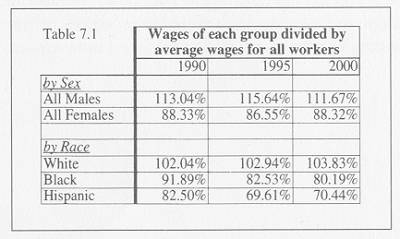 The positions of women and minorities relative to men and whites worsened between 1990 and 1995, as evidenced by the decline in their share of wages. While the equity position of women and Hispanics improved between 1995 and 2000, Hispanics were still worse off at the end of the decade than at the beginning. The equity position of blacks dropped steadily throughout the decade.
If education and skill levels are unchanged, then discrimination may indeed be a factor causing women and blacks to earn less than males or whites. In the case of Hispanics, whose share in the population rose since 1990, education and skills may be the explanation. Recent immigrants often have both language problems and lack of education, making it harder for them to earn money than immigrants who have been here longer.
What else would we like to know?
Understanding the causes of inequity is important; otherwise we won’t know how to change it. Data on wage rates controlled for education and language skills would show us the extent to which New Jersey’s problem is discrimination – which is illegal – or other differences that we can work to change through public education.
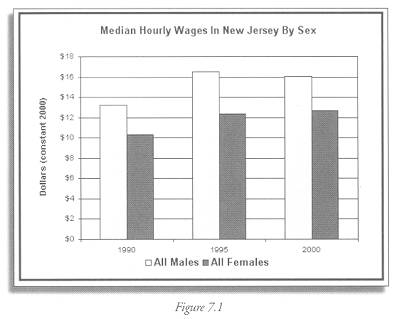
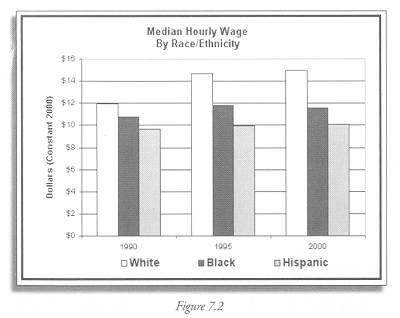
Figure 7.1 – 7.2 Current Population Survey (CPS) Earnings Microdata, 1990 1995 and 2000. Data provided by Sen-Yuan Wu, NJ Department of Labor
Indicator Target:
Targets with which to assess state progress have not yet been established for this indicator.