Why do we care?
Voting is the fundamental way that we exercise our right to self-government. Voter turnout is the basic measure of how many of us are exercising this right. By voting, we express our desires and set our priorities for less poverty, more jobs, a cleaner environment, less crime, and better education. When we vote, we fulfill an opportunity that few people have had throughout history, and for which people in this country and others have fought and died.
How are we doing?
Figure 18.1 shows voter turnout in presidential and state legislative elections, respectively, from 1967 to 2000.(1) While turnout for presidential and gubernatorial elections is much higher than for state legislative elections, all voter turnout rates have declined. Turnout for presidential elections dropped from 87% in 1968 to 69% in 2000. Turnout for state legislative elections dropped from 64% in 1967 to 31% in 1999.
What is behind these figures?
The voter turnout rate measures the proportion of registered voters who actually come to the polls. It does not tell us the share of eligible voters who are registered, however. Finding ways to increase voter registration rates has been a national challenge for decades. The enactment in 1993 of the National Voter Registration Act, or “motor voter,” was an effort to make registration easier. This law calls on the states to adopt a uniform registration system, and to permit voter registration as part of applying for a drivers’ license. Motor voter has increased voter registration in New Jersey, from 71.43 percent of those eligible in 1996 to 75.48 percent in 2000.(2)
This increase in registered voters may partly explain the dropping turnout rates, if voter turnout drives or motor voter register people who actually are not interested in voting. The steep decline in turnout for state legislative elections between 1995 and 1999 supports this hypothesis. However, while lowering barriers to voter registration is important, there are probably other causes of low voter turnout as well.
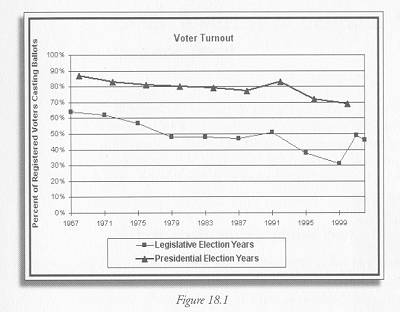
Figure 18.1 2002 data at: http://www.state.nj.us/lps/elections/elec2002/2002g_turnout.pdf
Earlier data in the Manual of the Legislature of New Jersey, 2001, “Statewide Voter Turnout Since 1970,” p. 877 General information on elections and voter turnout is athttp://www.state.nj.us/lps/elections
Indicator Target:
Targets with which to assess state progress have not yet been established for this indicator.
———-
(1) The state legislature turns over every two years, in odd years. This graph only includes the election years that were not gubernatorial election years, i.e. 1967, 1971, 1975, and so on.
(2) Federal Election Commission. The Impact of the National Voter Elections 1999 – 2000. Table 1. Voting Age Population and Voter http://www.fec.gov/pages/nvrareport2000/nvrareport2000.htm