Why do we care?
Traffic accidents are one outcome of the patterns of development that have come to dominate New Jersey, and indeed the whole United States. This indicator tracks fatal traffic accidents in New Jersey.
How are we doing?
As Figure 29.1 shows, the total number of fatalities has declined from 1,352 in 1968 to 747 in 2001, a decrease of almost 50%. The number of pedestrian fatalities dropped from 358 in 1968 to 132 in 2001, a decrease of more than 60%. Achieving the Department of Transportation’s targets for motorist and pedestrian fatalities presents a significant challenge.
What is behind these figures?
These decreases occurred despite a 20% increase in population and more than a 60% increase in vehicle miles traveled per person (Indicator 27) over the same time period. Explanations for this decrease may include greater vehicle safety which reduces the harm caused when accidents occur, faster and better emergency care which means more lives are saved after accidents, more use of seatbelts, and design of safer roads and reduced human-vehicle interactions.
An analysis of the causes of traffic accidents could shed light on how we can further reduce these figures. Changes in road design, such as better highways, and measures to reduce speeds in residential neighborhoods, may help. This will be particularly important for pedestrian fatalities. While the total number of fatalities has dropped in New Jersey, comparative data show that our road design makes the chance of pedestrian fatality three times greater in the US than in Germany and six times greater than in the Netherlands.(1)
Human factors may be even more important. In 2001, close to 40% of the drivers in fatal accidents in New Jersey had blood alcohol concentrations above 0.01 grams per deciliter, sufficient to consider the accidents alcohol-related.(2) Clearly a stronger focus on drinking and driving will be necessary to reduce traffic fatalities. More education for young drivers may also help. According to the U.S. Department of Transportation, the age group of 16 – 20 years has the highest rate of traffic deaths nationwide.(3) Clearly a great deal of work already goes into driver education; research on the most effective ways to reach target groups could help it be even more effective than it already is.
What else would we like to know?
The relationship between transportation patterns, smart growth, and automobile accidents is not clear. Presumably if we all drove less, accident rates would drop. More analysis is needed, however, to determine on what kinds of roads most accidents occur. Are vehicle-pedestrian interactions a bigger problem in residential neighborhoods or on roads characterized by strip development, like Route 18 in Middlesex County? Is the solution to build more limited-access highways? The relatively uniform speeds and relative lack of turning and laneshifting on major highways may make them safer for drivers; however the slower speeds on more accessible roads may mean that the effects of accidents are less. Interactions between cars and trucks are clearly very dangerous to the cars; exploring ways to manage truck traffic better should help reduce this portion of fatalities. More work is needed to determine how best to use the design of transportation systems to reduce accidents.
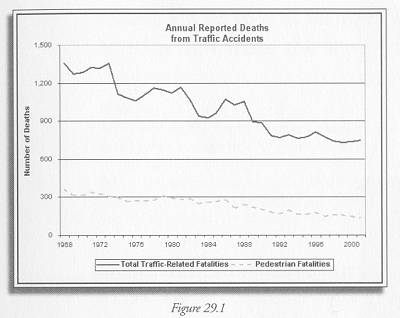
Figure 29.1 National Highway Traffic Safety Administration – Fatality Analysis Reporting System http://www.nhtsa.gov/
Indicator Target:
By 2010, reduce fatalities by 25% of 1998 level, to 559.
Most recent level (2001):
747
Pedestrian Fatalities Target:
By 2010, reduce fatalities by 50% of 1998 level, to 78.
Most recent level (2001):
132
Who set the targets:
1998 NJDOT, New Jersey First: A Transportation Vision for the 21st Century.
———-
(1) John Pucher and Lewis Dijkstra. “Promoting Safe Walking and Cycling to Improve Public Health: Lessons from The Netherlands and Germany.” American Journal of Public Health. Vol. 93 No. 9, September 2003. Final draft available at http://policy.rutgers.edu:16080/papers/15.pdf.
(2) National Highway Traffic Safety Administration – Traffic Safety Facts 2001 http://nhtsa.gov/pdf/nrd-30/NCSA/TSFAnn/TSF2001.pdf Table 114. Persons Killed, by State and Highest Blood Alcohol Concentration in the Crash
Table 115. Drivers Involved in Fatal Crashes, by State and Blood Alcohol Concentration of the Driver
Table 116. Drivers Killed in Fatal Crashes, by State and Blood Alcohol Concentration of the Driver
(3) Traffic Safety Facts 2001 – Older Population http://www-nrd.nhtsa.dot.gov/pdf/nrd-30/NCSA/TSF2001/2001olderpop.pdf